‘Our team did this, did that, we did everything right.’
‘So, why didn’t we get the desired results?’
It’s crucial to analyze your posts on social media. Every interaction should be studied, and every engagement should be considered.
Social media analytics help you monitor every movement on all the accounts. Your team set the goals high, but how will you know if they’re achieved or not?
To keep up with the pace of competitors, you have to be aware of the ifs and buts inside your own brand. Knowing which ways are working and which are not can be done only with a thorough analysis.
What Is Social Media Analytics?
Social media analytics means collecting data from your accounts and studying it. It helps check how you’re doing, learn about your fans, and pick better marketing moves.
Every like, comment, share, click, view, follow, or unfollow makes data. Just numbers alone don’t mean much.
Analytics turns them into smart tips: What posts do fans love? Which apps bring real wins? Where are you wasting time? What to do more?
No analytics? You’re just guessing. Post stuff, hope it works, and can’t prove the payoff. With it, you track a post to a site visit to a sale. Turns social from a money pit to a money maker.
A strong social media strategy is what connects these insights to real business results.
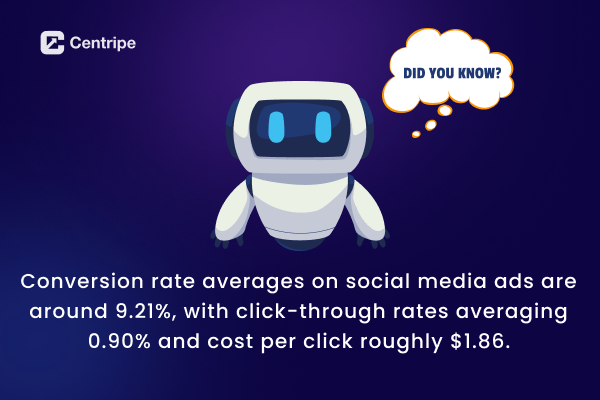
Ads convert at 1.5-3% usually. Smart trackers double or triple that by fixing based on data. Use it or lose it!
6 Types of Social Media Analytics
Not all analytics measure the same thing. Understanding these six types helps you know what to track and when.
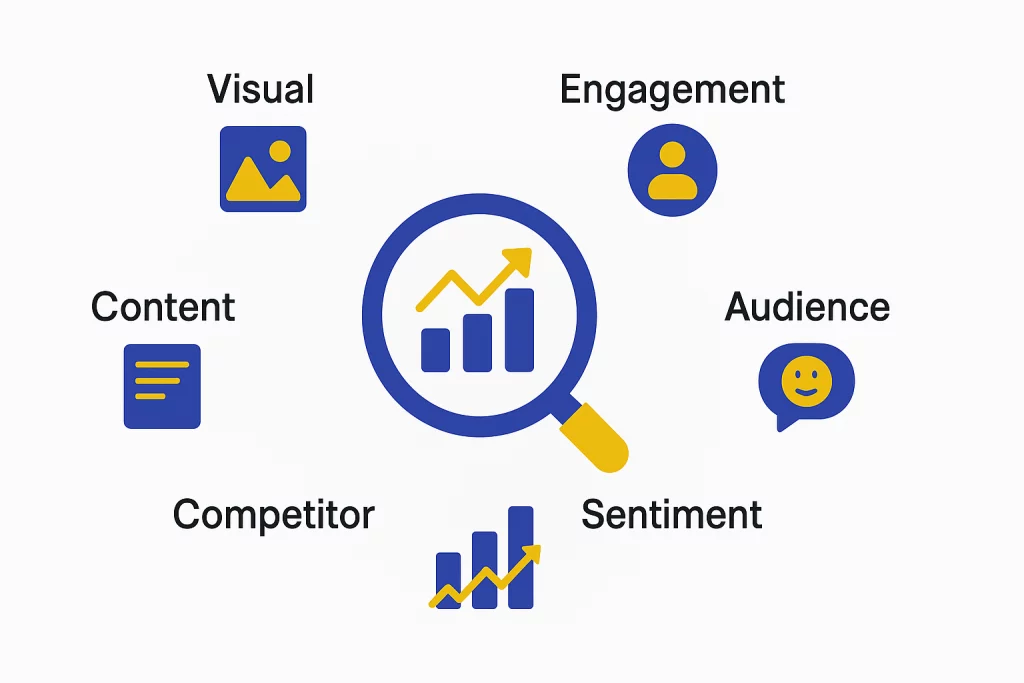
1. Engagement Analytics
This measures how people are interacting with your content. Likes, comments, shares, saves, clicks and replies.
This shows if your efforts in creating the content are actually worth or not. High reach with low engagement implies people are looking at your content but they are not interacting.
High engagement with low reach means your content is resonating but isn’t shown to more people.
Comments and shares indicate stronger engagement than likes because it requires more effort.
Saves indicate a strong intent signal. Track the engagement rate. I will give an example.
A post with 50 likes from 500 viewers with 10% engagement is out performing the one with 200 likes from 10,000 viewers with 2% engagement.
2. Audience Analytics
Brands should spend more time truly understanding their audience. Knowing what matters to them, which posts they like, and how they comment helps the marketing team decide better.
This clears up your view of who your audience really is.
Audience analytics helps you spot these patterns. Some people might love AI‑related posts, while others only click on discount or deal‑based posts.
These groups are like different “buyer types,” and each one should get personalized content that matches what they care about.
This is how brands build a loyal social media community that actively engages with their content over time.
3. Content Analytics
Content analytics tracks the performance of posts and campaigns. It tracks how many people saw them, how often they appeared, how many clicked, and what actions happened next.
Use content analytics to spot patterns. Which format works best, video, carousel, single image, or plain text?
Which topics get the most likes, comments, and shares? What posting times bring the most eyes? Does long‑form or short‑form content drive more clicks?
Over time, content analytics builds your own playbook for your audience. You stop guessing what to post and start knowing what works.
This keeps changing as your audience and app rules change, so checking the data regularly is important, not just once and done.
4. Competitor Analytics
It is about observing what other brands are doing on social media.
It covers how often they post, the type of content they share, their engagement levels, and how fast they gain followers.
Choose 4-6 direct competitors and review their accounts monthly.
Study likes, comments, shares and saves. Identify gaps in their strategy. If everyone is sharing educational content and skips behind the scenes videos, then its an opportunity for your brand to create it.
Competitor analytics also provides useful benchmarks. If your engagement rate is 2% and your top competitors is 5%, you see where you can improve.
5. Visual Content Analytics
Pictures, videos, infographics, and slide posts beat plain text on every platform. They grab more attention.
Use visual analytics to spot what works best for your crowd.
- Do short clips like Reels or TikToks get more views than long YouTube videos?
- Do your fancy branded graphics get more likes and comments than real-life photos?
- What colors, fonts, and layouts do people love most?
Video completion rate tells you a lot. If folks watch just the first 3 seconds and bounce, your start needs to hook them better.
If they watch 80% but skip your link or button, make your call-to-action clearer or punchier.
6. Sentiment Analysis
Sentiment analysis goes way past counting likes. It checks if people feel happy, mad, or neutral about your brand from their comments and talks.
Picture a post with 500 comments. Sounds great, right? But if 400 complain about slow shipping, this tool spots the trouble quick, before it hurts your image big time.
Track how feelings shift over time. A slow drop from positive to meh might mean your brand’s losing spark.
A fast spike in negatives could point to a bad product, PR slip-up, or sneaky competitor. Spot it early, and you fix it smart, not in a panic.
6 Reasons Why Social Media Analytics Matter
1. Predicting Future Trends
It’s very important to know what the future trends will be, as it will give you time to strategize before everyone else.
Social media analytics tracks small changes in what people like, what they engage with, and what are they talking about.
Smart teams watch this stuff live. They switch to hot topics or styles right away, while others stick to old plans.
2. Optimizing Content Longevity
Analytics doesn’t just show day-one hits. It tracks how posts keep pulling people in for weeks or months. Some fade quick; others keep delivering for weeks.
This tells you where to put your effort. If big guides bring traffic forever but quick tips die quick, make more guides.
3. Discovering Hidden Audience Segments
Basic targeting spots the big groups. Analytics let you know about fan clubs inside your crowd. They love certain topics, styles, or formats, that your team didn’t expect.
These groups can bring high revenue. For example, a software company finds freelancers loving their stuff. Then, its time to make special messages or prices just for them.
These insights can also be extended into lead generation campaigns to nurture these segments more effectively.
Centripe integrates the social media with AI, which can create and send emails/messages instantly to capture the leads.
4. Preventing Reputation Crises
Keep watching to catch bad vibes, fake news, or weird spikes early, before they blow up.
Look for fast-rising chatter, mood flips from good to bad, or odd likes and drops. Check any signal quick. Fixing at 50 complaints beats dealing with 5,000.
5. Discovering Cross-Platform Synergies
Analytics shows how one platform’s win boosts others. A hot LinkedIn post might grow your Instagram fans.
A YouTube video could spark Twitter buzz. Use these links to make campaigns that spread big, not stay stuck in one spot.
6. Validating Creative Decisions with Data
Analytics gives straight answers on your wild ideas. It proves what clicks and what flops.
This lets you take smart chances. Test a new format, check the numbers, and decide. Data kills the arguments and makes choices based on facts.
7 Simple Social Media Analytics Strategies
1. Set Clear Goals and Track the Right Metrics
Start by knowing your goal. Different aims need different numbers to watch.
For building fame, check reach, views, new followers, and how much industry talk you own. For chats, watch likes, comments, shares, saves, and clicks.
For sales, track site visits from social, sign-ups, buys, and cost per customer. For help desk, note reply speed, fixes, and happy scores.
Pick just 3-5 that tie to your main goal. Watching everything means tracking nothing.
2. Monitor Real-Time Engagement Patterns
Social moves quick. Watch live so you can jump on trends, talks, and chances as they pop.
Spot when followers are online most, which posts light up fast (good for the algorithm), brand mentions (tagged or not), and how quick you reply.
This catches bad stuff early too. Nip a complaint thread at the first note, not the hundredth.
3. Analyze Audience Sentiment Regularly
Don’t just count likes, feel the mood. Tools sort mentions as good, bad, or meh.
Check trends weekly.
Slow drop might mean boring content or a sneaky product glitch. Fast crash points to a clear problem, fix now. Good spikes? Do more of that.
4. Compare Performance Across Platforms
Same post flops or flies on different spots. Instagram carousels might kill it; LinkedIn hates them. Long posts rock on LinkedIn, die on TikTok.
Check each platform monthly. See top content types per spot, which sends most traffic, best engagement, and sales per effort. Put money where it pays best.
5. Benchmark Against Competitors
Your numbers alone don’t tell all. A 3% engagement win feels lame if rivals hit 7%.
Compare 3-5 rivals monthly on followers, engagement, post speed, and moods.Copy their wins. Grab spots they miss.
6. Connect Social Media to Revenue
Real value shows in cash. Track from social view to site visit to lead to sale.
This approach ensures your content efforts directly contribute to consistent lead generation.
7. Build Regular Reports and Iterate
Data’s worthless without changes. Make reports weekly for team, monthly for bosses, to spark action.
Answer what happened, why, and next steps. A chart of falling likes is okay. One saying “videos down 40%, back to 3/week next month” gets stuff done.
How to Build a Social Media Report?
A good report shows what happened, what worked, and what to do next. It connects activity to results and gives stakeholders the data they need to support your efforts.
Report Structure
1. Executive Summary
Kick off with 3-4 key points. What got better? What slipped? What’s the fix? Bosses often read just this, so nail it.
2. Overall Performance
Show total new followers, reach, views, and engagement across platforms. Add month-to-month changes to show if you’re heading up or down.
3. Platform Breakdowns
For each platform, list main stats like followers, reach, and engagement rate. Share top posts, who your crowd is, and growth over time. Use charts, people understand pictures better than words.
- For Instagram: followers, reach, engagement, new fans. Break out Reels vs feed vs Stories. Table every post’s views, reach, likes, comments.
- For Facebook: followers, reach, views, post count. Likes, comments, shares, clicks. Trend lines for engagement, pie for interaction types. Top posts and where fans are from.
- For YouTube: subscribers, watch time, views, likes, comments. Graph growth and views vs watch length. Stats per video, fans gained each.
- For LinkedIn: followers, views, engagement, clicks. Top posts and how types do (text, articles, carousels).
4. Content Performance
Point out winning content types. List top 5-10 posts. Call out flops and why they tanked.
5. Paid Advertising Results
Cover ad cash spent, click rate, cost per click, conversions, and return on spend. Compare to free posts to show ads’ extra punch.
6. Traffic and Conversions
Link social to real wins. Site visits from social? Leads or sales? This proves your money’s worth it.
7. Audience Insights
Break down age, gender, location, devices. Spot changes, like crowd getting younger or phone-heavy, and tweak content to match.
8. Recommendations
Wrap with 3-5 clear fixes from the data. Say “Do more Reels,they got 3x likes over pics” with who does it and by when. Skip vague stuff like “get more engagement.”
Key Metrics Explained
Impressions count every time your post shows up. One person sees it five times? That’s five impressions.
Reach counts unique people. One thousand people see it? That’s one thousand reach. Reach shows how wide your crowd is; impressions show how often they see you.
Engagement rate is your top go-to number for how posts do. It’s total likes, comments, shares divided by reach (or views). High rate means your stuff clicks deep, even with a small group.
Click-through rate (CTR) shows what percent clicked your link. It proves if your post pulls people off the platform to your site.
ROAS (return on ad spend) is the big win for paid ads. Revenue from ads divided by what you spent. 4x means every buck spent brings back four.
Cost per result tells cost for each win, like per lead, sale, or app download. Use it to pick the best ad campaigns and spend smart.
No Spam. No calls. Unsubscribe anytime.
Why Agencies Need Social Media Analytics Tools
For agencies switching between many clients, analytics tools are like the backbone of your ops. Without them, you pull data by hand from every platform for every client. That eats up dozens of hours each month.
Pro tools pull all accounts into one screen. They auto-make reports on time, let you compare clients, and track history for trends and guesses on what’s next.
Time saved pays for itself. With 10 clients, manual work might take 40+ hours a month. Tools cut it to 5-10, with better, sharper reports. Use that time for real strategy and tweaks that boost wins.
These tools level up client chats too. Skip fluffy stats, show paths to sales, money traced back, and real ROI. Clients see social’s power, spend more, and stick around longer.
Conclusion
Social media analytics platforms like Centripe are best to get detailed reports of your posts and reels are doing.
Keeping track is the best way to focus on things that matter. Once you maintain the balance of what’s working and what’s not, you save a lot of resources for business.
Teams are aligned, and they know which strategies would be more impactful. They get an idea of the path ahead.